 |
Online Reporting Dashboard |
|
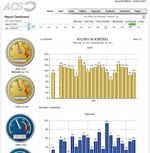
The Account Dashboard offers a one stop view into the volume of service we have
provided in a given time period. Start here to get an overview of calls
and shipments, and to find out more you can simply click on any graph to drill
down into the details. |
|
|
|
 |
Root Cause Analysis |
|
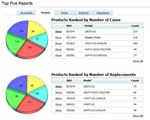
Looking into our top five reports will give you the areas you should address
first to get the biggest bang for your buck. We rank models, parts,
question type by the issues that have occured. You can use it to identify
the issues that occur most often so that you can spend your time on product
development and not data analytics. |
|
|
|
 |
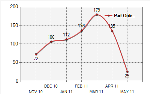
Support Trending |
|
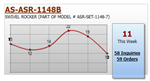
Find out which items are increasing in the ammount of support needed so that you
can address possible problems early. This report shows a rolling 6 week
line graph and the levels of the current week. Click on any of the figures
to asess the top questions, or part orders for that 6 week period. |
|
|
|
 |
Geograpic |
|
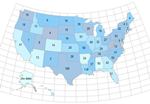
Find out exactly where your calls are coming from, and where you are shipping
parts to to. This will tell you if you have a reginal problem, or specific
areas of the country that your product is used more often. |
|
|
|
 |
Inventory Flow |
|
With our inventory flow reports you can not only monitor your inventory levels
but also know ahead of time when you can expect to be out of stock. bieng
ahead of the game on parts fulfillment will ensure that the number of units
returned to the store is at a minimum. |
|
|
|
|
|
|